【Arduino&Pmod NAV】地磁気センサからヨー軸算出
前書き
加速度センサとジャイロセンサを使って姿勢角を算出するのは、以前に複数個の記事で行っています。
shizenkarasuzon.hatenablog.com
shizenkarasuzon.hatenablog.com
ですが、今回は地磁気センサを使って姿勢角(ヨー角のみ)を算出してみようと思います
部品
僕の環境では以下の部品を使いました。
これを、以下のように接続します。
Arduino UNO の場合:
PmodNAV<---> Arduino
pin 6     3.3V
pin 5     GND
pin 4     A5
pin 2     A4
Arduino Due の場合
PmodNAV<---> Arduino
pin 6     3.3V
pin 5     GND
pin 4     21(SCLピン)
pin 2     20(SDAピン)
繋げるとこんな感じになります。

3軸地磁気センサについて
地磁気センサ(電子コンパス)は地球の磁力を検出するセンサで、「北」の方角にあたるような方向を三次元(2次元のものもある)のベクトルで計測します。理想的な状態を考えると、センサを回転させると計測値 は原点を中心とする球の表面上に分布するはずです。(二次元の場合は円周上)
しかし、実際には周辺地場の影響により、ベクトルが少し平行移動してしまいます。そこで、それを補正する必要があります。具体的には、測定した値は中心が原点からずれた球の表面上に分布するような感じになります。そこで、三軸地磁気センサの場合は球補正、二軸地磁気センサの場合は円補正をする必要があります(下の節で円補正しています)
そして、補正した値を使えば、ヨー角 を算出することができます。
センサーが水平に設置されている場合の算出は簡単で、です。
しかし、センサーが傾いていると、以下の式の様になるようです。
参考→3軸方位センサを用いた姿勢推定 – Watako-Lab.
ここで、は地磁気センサの測定値、
はpitch角のcos,
はroll角のsinを表しています。
pitchとrollは地磁気センサから求められないので、加速度センサなどから求める必要があります。
動作確認(センサ値取得)
とりあえず、PmodNAVで地磁気センサの値を測定してみます。
// Arduinoプログラム。地磁気センサの計測値(m_x, m_y, m_z)をシリアル通信でPCの送る)
#define RAD_2_PI 57.3248

#include <Wire.h>
#include <SparkFunLSM9DS1.h>

float magX, magY, magZ;

double pitch, roll, yaw = 0;

#define LSM9DS1_M 0x1E
#define LSM9DS1_AG 0x6B

LSM9DS1 imu;

void setup(void){
  Serial.begin(115200); // initialization of serial communication
  imu.settings.device.commInterface = IMU_MODE_I2C; // initialization of the module
  imu.settings.device.mAddress = LSM9DS1_M;
  imu.settings.device.agAddress = LSM9DS1_AG;
  if (!imu.begin()){
    Serial.println("Probleme de communication avec le LSM9DS1.");
    while (1);
  }
  accX = imu.ax;
  accY = imu.ay;
  accZ = imu.az;
  gyroX = imu.gx;
  gyroY = imu.gy;
  gyroZ = imu.gz;

  delay(100);//Wait for sensor to stablize
}

void printAttitude(void){
  Serial.print(imu.mx);
  Serial.print(",");
  Serial.print(imu.my);
  Serial.print(",");
  Serial.println(imu.mz);
  delay(2);
}


void loop(){
  if (imu.magAvailable())  imu.readMag();

  magX = imu.mx;
  magY = imu.my;
  magZ = imu.mz;
  printAttitude();
}
↑のプログラムをArduinoに書き込み、Processingでリアルタイムでプロットしてみます。
//Processingのプログラム。USBでArduinoとつないでから実行してください
float x,y,z;
import processing.serial.*;

Serial myPort;
float pitch, roll, yaw;
String myString;
PImage img;

int window_size = 800;

void setup() {
  myPort = new Serial(this, "COM4", 115200); //COMポートの番号は環境によって設定してください。デバイスマネージャー等で確認できます。
  myString = "";
  frameRate(30);
  smooth();
  myPort.bufferUntil('\n');

  pitch = 0; roll = 0; yaw = 0;
  background(0,0,0);
  size(800, 800);

  stroke(255, 0, 0);
  line(0, window_size/2, window_size, window_size/2);
  stroke(0, 255, 0);
  line(window_size/2, 0, window_size/2, window_size);
  noFill();
  stroke(255,255,0);
  rect(window_size/2 - 100, window_size/2 - 100, 200, 200);
}

void draw() {
  int sensors[] = int(split(myString, ','));
  if (sensors.length > 2) {
      x = sensors[0] / 10 + window_size/2;
      y = sensors[1] / 10 + window_size/2;
      noStroke();
      fill(0,255,255);
      ellipse(x,y,5,5);
      println(myString);
  }
}


void serialEvent(Serial myPort){
  myString = myPort.readStringUntil('\n');
  if (myString != null) {
    myString = trim(myString);
  }
}
すると、こんな感じになります
今回の目的はセンサーを水平に固定した状態でヨー角を測定することなので、と
をプロットしています。ほんとはきちんと水平を測って測定しないといけないんだろうけど、適当にやったので測定値が分散してしまっています。
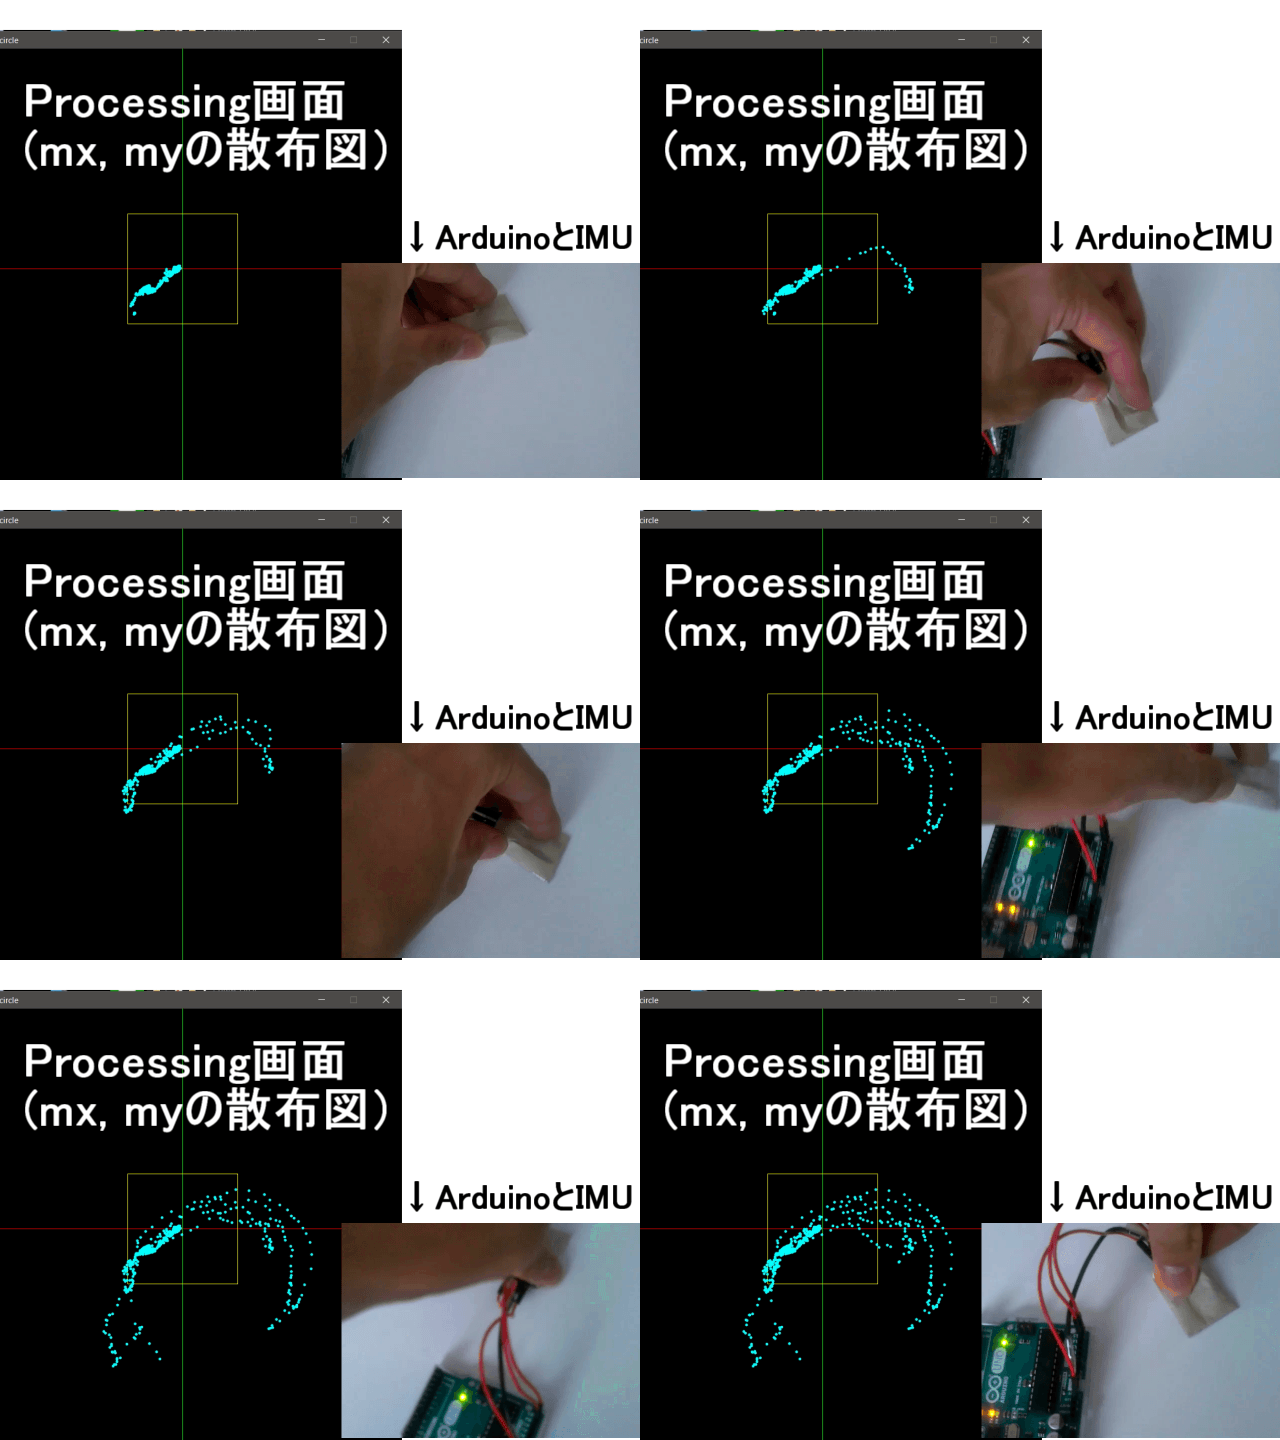
赤と青の直線の交点が原点ですが、センサーの測定値の円(?)の中心が原点から大きくずれていることは確かでしょう。ということで、円補正に入ります。
円補正
先ほどプロットしたの値をもとに、Pythonを用いて円推定を行います。
import numpy as np
import math
import random
import matplotlib.pyplot as plt


def CircleFitting(x,y):
    # https://www.youtube.com/watch?v=bDYDZJvVHPYのコピペです。
    sumx  = sum(x)
    sumy  = sum(y)
    sumx2 = sum([ix ** 2 for ix in x])
    sumy2 = sum([iy ** 2 for iy in y])
    sumxy = sum([ix * iy for (ix,iy) in zip(x,y)])

    F = np.array([[sumx2,sumxy,sumx],
                  [sumxy,sumy2,sumy],
                  [sumx,sumy,len(x)]])

    G = np.array([[-sum([ix ** 3 + ix*iy **2 for (ix,iy) in zip(x,y)])],
                  [-sum([ix ** 2 *iy + iy **3 for (ix,iy) in zip(x,y)])],
                  [-sum([ix ** 2 + iy **2 for (ix,iy) in zip(x,y)])]])

    T=np.linalg.inv(F).dot(G)

    cxe=float(T[0]/-2)
    cye=float(T[1]/-2)
    re=math.sqrt(cxe**2+cye**2-T[2])
    #print (cxe,cye,re)
    return (cxe,cye,re)  #(推定した円の中心x座標, 中心y座標、半径)


def main():
    x_list = []
    y_list = []
    z_list = []

    # データ読み込み
    with open("test.txt") as f: # シリアル通信で受信した、地磁気センサの計測値をテキスト形式で保存してあるのでそれを読み込む
        s = f.read().split("\n")
        lines = 0
        for data in s:
            data2 = data.split(",")
            lines += 1
            try:
                x_list.append(int(data2[0]))
                y_list.append(int(data2[1]))
                z_list.append(int(data2[2]))
            except:
                print("error -> line = " + str(lines) + ", data = " + str(data2))

    # 円推定
    (cxe,cye,re)=CircleFitting(x_list, y_list)
    print(cxe,cye,re)


    #描画
    theta=np.arange(0,2*math.pi,0.1)
    xe=[]
    ye=[]
    for itheta in theta:
        xe.append(re*math.cos(itheta)+cxe)
        ye.append(re*math.sin(itheta)+cye)
    xe.append(xe[0])
    ye.append(ye[0])

    plt.plot(x_list,y_list,"ob",label="raw data")
    plt.plot(xe,ye,"-r",label="estimated")
    plt.plot(cxe,cye,"xb",label="center")
    plt.axis("equal")
    plt.grid(True)
    plt.legend()
    plt.show()

main()
その結果、以下の画像になりました。
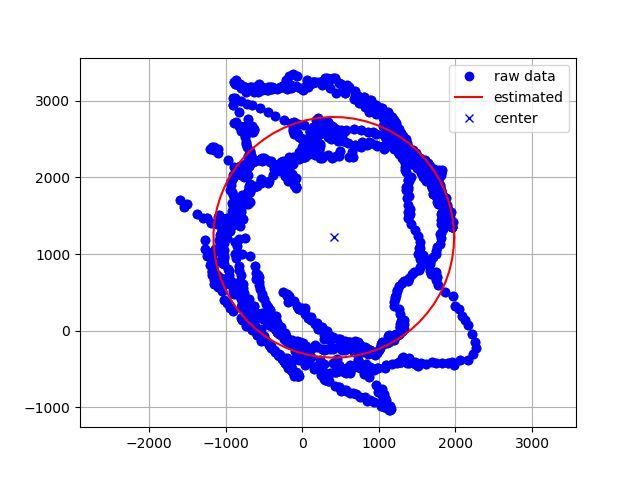
青いドットが測定した値 で、その測定値に円フィッティングを行った結果が赤い円です。
この赤い円は中心座標は(411, 1218) 半径は1570でした。つまり、周辺地場が(411, 1218) だけ働いているので、その分だけ計測値から引いてヨー角を算出する必要があります。
で、下の様なプログラムになります。
最終スケッチ
#define RAD_2_PI 57.3248
#include <Wire.h>
#include <SparkFunLSM9DS1.h>

double accX, accY, accZ;
double gyroX, gyroY, gyroZ;
float magX, magY, magZ;

double pitch, roll, yaw = 0;

#define LSM9DS1_M 0x1E
#define LSM9DS1_AG 0x6B

LSM9DS1 imu; // Creation of the object imu

void setup(void){
  Serial.begin(115200); // initialization of serial communication
  imu.settings.device.commInterface = IMU_MODE_I2C; // initialization of the module
  imu.settings.device.mAddress = LSM9DS1_M;
  imu.settings.device.agAddress = LSM9DS1_AG;
  if (!imu.begin()){
    Serial.println("Probleme de communication avec le LSM9DS1.");
    while (1);
  }
  accX = imu.ax;
  accY = imu.ay;
  accZ = imu.az;
  gyroX = imu.gx;
  gyroY = imu.gy;
  gyroZ = imu.gz;
  delay(100);//Wait for sensor to stablize
}

void printAttitude(void){
  Serial.print(pitch);
  Serial.print(",");
  Serial.print(roll);
  Serial.print(",");
  Serial.println(yaw);
  delay(2);
}


void loop(){
  if (imu.gyroAvailable())imu.readGyro();
  if (imu.accelAvailable())imu.readAccel();
  if (imu.magAvailable()) imu.readMag();

  accX = imu.ax;
  accY = imu.ay;
  accZ = imu.az;
  gyroX = imu.gx;
  gyroY = imu.gy;
  gyroZ = imu.gz;
  magX = imu.mx - 411; //値補正!
  magY = imu.my - 1218; // 値補正!
  magZ = imu.mz;

  /*角度を求める*/
  roll  = atan2(accY, accZ);
  pitch = atan(-accX / sqrt(accY * accY + accZ * accZ));
  yaw = atan2(magY, magX);

  printAttitude();
}
上のプログラムを実行すると、pitch, roll, yawの値がシリアルモニタに出力されると思います。
試しにProcessingで同期してみました。うまくいっているようです。(回転方向が逆ですが)

Pythonでイージングを試してみる
イージングとは
イージング(Easing)は日本語では緩急を意味します。

うえの動画の様に動きに緩急をつけることで、より自然で滑らかに表現ができるようになります。
- (イーズイン)ease in → 最初はゆっくり、最後は高速。
- (イーズアウト)ease out → 最初は高速、最後はゆっくり(↑の動画の動き)
動画制作現場以外にもCSSでもイージングを使ったアニメーションがあるようです
Pythonプログラム(物体移動)
下のプログラムを実行すると、以下の様なGIFアニメーションが作成されます。

def sampleFunc(time, begin, change, duration):
  return -change * (( time / duration - 1)**4- 1) + begin


class Easing_Simulator:
    start = 0.0
    change = 100.0
    duration = 3.0

    def __init__(self):
        self.time = 0.0
        # plot設定
        self.fig = plt.figure()
        self.ax = plt.axes(xlim = (-30,130),  ylim=(-5,5))
        self.circle = plt.Circle((0., 0.), 5)
        self.ax.set_aspect("equal")
        self.ax.add_patch(self.circle)
        self.anim = animation.FuncAnimation(self.fig, self.update, interval=33, frames = 30)


    def update(self, _):
        self.time += 0.1
        self.circle.center = (sampleFunc(self.time, self.start, self.change, self.duration), 0)

    def show(self):
        plt.show()

    def save(self):
        self.anim.save("test.gif",writer='imagemagick', fps = 30)


sim = Easing_Simulator()
sim.save()
#sim.show()
円のx座標がsampleFunc関数の値によって制御されています。sampleFuncは、t=0の時のx座標をstart, t = durationの時のx座標をendとして時刻tにおけるx座標を出力する関数です。この関数を変えることによってさまざまなイージングを表現することができます。(例はこの記事の下の方)
Pythonプログラム(グラフ表示)
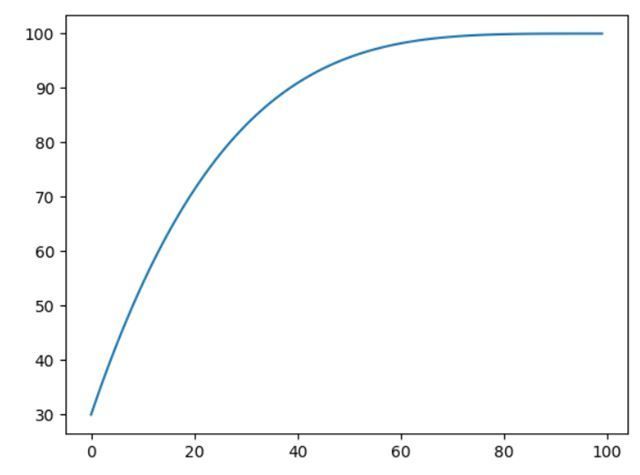
下のプログラムを実行すると、横軸が時刻、縦軸がイージング値のグラフがプロットされます。
def sampleFunc(time, begin, change, duration):
  return -change * (( time / duration - 1)**4- 1) + begin

class graph_plot:
    start = 30.0
    change = 70.0
    duration = 10.0

    def __init__(self):
        self.time = 0.0

    def plot(self):
        pos = []
        for i in range(100):
            pos.append(sampleFunc(self.time, self.start, self.change, self.duration))
            self.time += 0.1
        plt.plot(pos)
        plt.show()

P = graph_plot()
P.plot()
いろいろなイージング
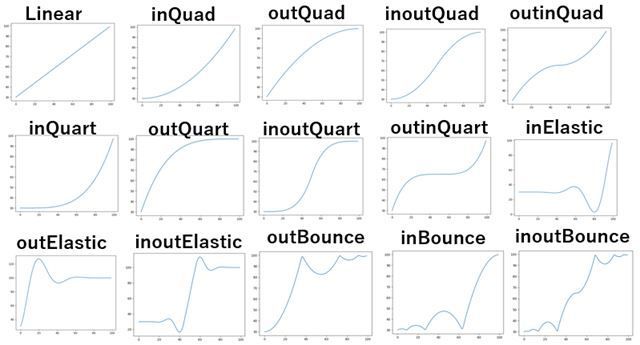
from math import *

def Linear(time, begin, change, duration):
    return change * time / duration + begin

def inQuad(time, begin, change, duration):
  return change * (time/duration)**2 + begin

def outQuad(time, begin, change, duration):
  return -change * (time/duration) * (time/duration - 2.) + begin

def inOutQuad(time, begin, change, duration):
  if time/duration < 0.5:
    return change / 2 * ((time/duration) * 2)** 2 + begin
  else:
    return -change / 2 * (((time/duration) * 2 - 1) * ((time/duration) * 2 - 3) - 1) + begin

def outInQuad(time, begin, change, duration):
  if time < duration / 2:
    return outQuad (time * 2, begin, change / 2, duration)
  else:
    return inQuad((time * 2) - duration, begin + change / 2, change / 2, duration)

def inCubic(time, begin, change, duration):
  return change * (time/duration)**3 + begin

def outCubic(time, begin, change, duration):
  return change * ((time/duration-1)**3 + 1) + begin

def inOutCubic(time, begin, change, duration):
  t2 = time/duration*2
  if time/duration < 0.5 :
    return change / 2 * t2**3 + begin
  else:
    return change / 2 * ((t2-2)**3 + 2) + begin

def outInCubic(time, begin, change, duration):
  if time/duration < 0.5:
    return outCubic(time * 2, begin, change / 2, duration)
  else:
    return inCubic((time * 2) - duration, begin + change / 2, change / 2, duration)


def inQuart(time, begin, change, duration):
  return change *(time/duration)**4 + begin


def outQuart(time, begin, change, duration):
  return -change * (( time / duration - 1)**4- 1) + begin

def inOutQuart(time, begin, change, duration):
  if time/duration < 0.5:
    return change / 2 * (time / duration * 2)**4 + begin
  else:
    return -change / 2 * ((time / duration*2-2)**4 - 2) + begin


def outInQuart(time, begin, change, duration):
  if time/duration < 0.5:
    return outQuart(time * 2, begin, change / 2, duration)
  else:
    return inQuart((time * 2) - duration, begin + change / 2, change / 2, duration)


from  math import *
def inSine(time, begin, change, duration):
  return -change * cos(time / duration * (pi / 2)) + change + begin

def outSine(time, begin, change, duration):
  return change * sin(time / duration * (pi / 2)) + begin

def inOutSine(time, begin, change, duration):
  return -change / 2 * (cos(pi * time / duration) - 1) + begin

def outInSine(time, begin, change, duration):
  if time/duration < 0.5:
    return outSine(time * 2, begin, change / 2, duration)
  else:
    return inSine((time * 2) -duration, begin + change / 2, change / 2, duration)


def inCirc(time, begin, change, duration):
  return change * (1 - sqrt(1 - time / duration)) + begin


def outCirc(time, begin, change, duration):
  return change * sqrt(time / duration) + begin


def inOutCirc(time, begin, change, duration):
  if time/duration < 0.5:
    return -change / 2 * (sqrt(1 - (time / duration * 2) **2) - 1) + begin
  else:
    return change / 2 * (sqrt(1 - (time / duration * 2 - 2) **2) + 1) + begin


def outInCirc(time, begin, change, duration):
  if time/duration < 0.5:
    return outCirc(time * 2, begin, change / 2, duration)
  else:
    return inCirc((time * 2) - duration, begin + change / 2, change / 2, duration)


def InElastic(time, begin, change, duration):
    return change * (time/duration)**4  * sin(time/duration * pi * 4.5 ) + begin


def OUtElastic(time, begin, change, duration):
    return (1 -  (time/duration - 1)**4 * cos( time/duration * pi * 4.5 )) * change + begin


def InOutElastic(time, begin, change, duration):
    if time/duration < 0.45:
        return change *8 * (time/duration)**4 * sin( time/duration * pi * 9 ) + begin
    elif time/duration < 0.55:
        return change*(0.5 + 0.75 * sin( time/duration * pi * 4 )) + begin
    else:
        return change * (1 - 8 * (time/duration - 1)**4 * sin( time/duration * pi * 9)) + begin


def outBounce(time, begin, change, duration):
  if  time / duration < 1 / 2.75:
    return change * (7.5625 * (time/duration)**2) + begin
  elif  time / duration < 2 / 2.75:
    return change * (7.5625 * (time/duration - (1.5 / 2.75))**2 + 0.75) + begin
  elif time/duration < 2.5 / 2.75:
    return change * (7.5625 *(time/duration - (2.25 / 2.75))**2+ 0.9375) + begin
  else:
    return change * (7.5625 * (time/duration - (2.625 / 2.75))**2+ 0.984375) + begin


def inBounce(time, begin, change, duration):
  return change - outBounce(duration - time, 0, change, duration) + begin

def inOutBounce(time, begin, change, duration):
  if time/duration < 0.5 :
    return inBounce(time * 2, 0, change, duration) * 0.5 + begin
  else:
    return outBounce(time * 2 - duration, 0, change, duration) * 0.5 + change * .5 + begin


def outInBounce(time, begin, change, duration):
  if time/duration < 0.5 :
    return outBounce(time * 2, begin, change / 2, duration)
  else:
    return inBounce((time * 2) - duration, begin + change / 2, change / 2, duration)
【OpenCV/C++】画像に3DLUTをあてる(適応させる)プログラム!(立方体補正)
LUTとは
LUT(Lookup Table、ルックアップテーブル)とは、
複雑な計算処理を単純な配列の参照処理で置き換えて効率化を図るために作られた、配列や連想配列などのデータ構造のことをいう。(by Wikipedia)
だそうですが、画像処理の場合はカラーグレーディングで使われる技術の一つを表しています。LUT情報を格納しているファイル(拡張子は.cubeなど)があり、それを画像に適応すると色身の補正を行ってくれる、というものです。
LUTファイルの中には、入力されたRGB色と、それに対応する出力用のRGB色が一覧表(1DLUTの場合は少し違う)の様に書かれています。このRGB色の対応表を利用して、画像の色身を補正しようという考え方です。
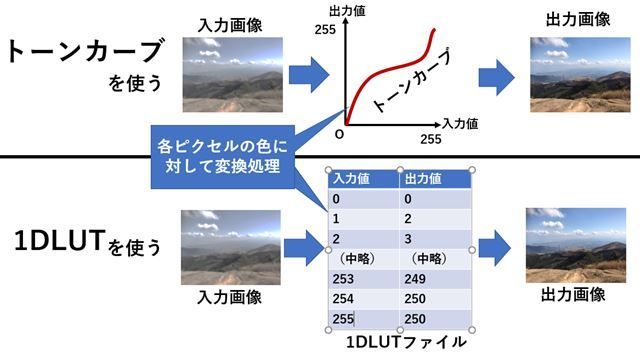
1DLUTと3DLUT
画像処理の分野では1DLUTと3DLUTがあります。(D→Dimension「次元」の意味)
それぞれの違いは入出力の値にあります。
上の画像の表は1DLUTを表しています。3DLUTは
| 入力色 | 出力色 |
| (0.0, 0.0, 0.0) | (0.0, 0.0, 0.0) |
| (0.5, 0.0, 0.0) | (0.6, 0.03, 0.05) |
| (1.0, 0.0, 0.0) | (1.0, 0.1, 0.1) |
| (0.0, 0.5, 0.0) | (0.0, 0.5, 0.0) |
| 略 | 略 |
| (1.0,1.0,1.0) | (1.0,1.0,1.0) |
の様になっています。3DLUTファイルの一つである.cubeファイルの中身をのぞいてみると、以下のようになっています。
# Vlog_to_V709_forV35_ver100.cube by panasonic
LUT_3D_SIZE 33

0.015625 0.015625 0.015625
0.028320 0.011719 0.013184
0.040771 0.008057 0.010742
0.054688 0.003906 0.008301
0.072021 0.000000 0.004883
0.093750 0.000000 0.000977
0.120850 0.000000 0.000000

(略)

0.995116 1.000000 1.000000
0.996825 1.000000 1.000000
0.998535 1.000000 1.000000
1.000000 1.000000 1.000000
LUTファイルの拡張子
- 3dl
- .cube
- .csp
- vlt
等がよく見ます。
↑このサイトを見ると、他にも
- .lut
- .cdl
- .ccc
- .clf
- .itx
- .look
- .m3d、.mga
- .spi1d
- .spi3d
- .spimtx
- .vf
などいろいろあるようです。
LUTの格子点
ということで、↑の考え方に基づくならば、3DLUTには全ての色に対する出力色の対応表が格納されていることになりますが、
もし10bitの画像だった場合、LUTファイルの容量はも必要になります(参考)。これはまずいです。3DLUTですべての組み合わせのテーブルを準備することは事実上不可能という事になります。
そこで、対応色を間引いてLUTファイルに保存しよう、という事になりました。RGB色空間で見た時にその保存するデータの点が格子状になり、「格子点」という呼ばれ方をしています。
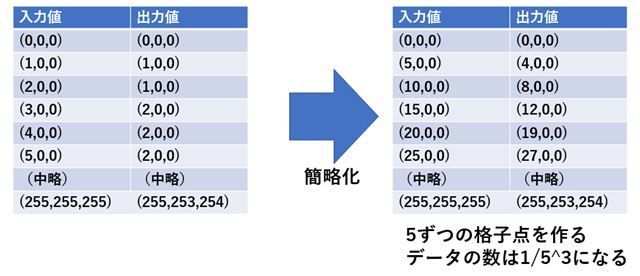
主な格子点数は17、33、65などです。(0~256(10bitの場合は0~1024)までの値をそれぞれ17、33、65分割するという意味)
立方体補間
上の節で、LUTファイルの容量を節約するため、データを間引きました。しかし、LUTをあてる(適応させる)時には間引いたデータを復元する必要があります。
その為に、この記事では立方体補間()を使います。(←あくまで「この記事では」の範囲内。ほかにも三角錐補間などがある。)
立方体補間とトライリニア補間の違いが判らなかったので、ここら辺は間違っているかもしれませんが、もし一緒ならば補間の計算式は↓に載っていました。
Trilinear interpolation - Wikipedia
プログラム(補間なし)
# include <opencv2/opencv.hpp>
# include <opencv2/highgui.hpp>
# include <iostream>
#include <vector>
#include <string>
#include <fstream>

#define DISP(X) (std::cout << #X << " = "  << X << std::endl)

// https://qiita.com/iseki-masaya/items/70b4ee6e0877d12dafa8 を参考にしました
std::vector<std::string> split_naive(const std::string &s, const char delim) {
  std::vector<std::string> elems;
  std::string item;
  for (char ch : s) {
    if (ch == ' ') {
      if (!item.empty())
        elems.push_back(item);
      item.clear();
    }else {item += ch; }
  }
  if (!item.empty())
    elems.push_back(item);
  return elems;
}

#define LUT_SIZE 33

class my3D_lut_simple{
private:
  int lut_size;
  cv::Mat src;
  cv::Mat dst;
  unsigned char lut_data[LUT_SIZE * LUT_SIZE * LUT_SIZE][3];

public:
  // read .cube file
  int read_lut_file(std::string filename) {
    std::ifstream ifs(filename);
    std::string one_line;

    int i = 0;
    while(i < LUT_SIZE * LUT_SIZE * LUT_SIZE){
      getline(ifs, one_line);
      std::vector<std::string> values = split_naive(one_line, (char)" ");


      if (values.size() != 3) { std::cout << one_line << " --> " << values.size() << std::endl; continue; }

      lut_data[i][0] = ::atof(values[0].c_str()) * 255;
      lut_data[i][1] = ::atof(values[1].c_str()) * 255;
      lut_data[i][2] = ::atof(values[2].c_str()) * 255;
      i++;
    }
  }

  void setSrcImg(cv::Mat src_img) {
    src = src_img;
    dst = cv::Mat::zeros(src.size(), src.type());
  }

  void convert() {
    if (src.empty()) { std::cout << "src image is empty!"; return; }

    int x, y, index;
    int r, g, b;
    for (y = 0; y < src.rows; y++) {
      cv::Vec3b* p_src = src.ptr<cv::Vec3b>(y);
      cv::Vec3b* p_dst = dst.ptr<cv::Vec3b>(y);

      for (x = 0; x < src.cols; x++) {
        r = float(p_src[x][0]) * LUT_SIZE / 256.0f;
        g = float(p_src[x][1]) * LUT_SIZE / 256.0f;
        b = float(p_src[x][2]) * LUT_SIZE / 256.0f;
        index = r + g * LUT_SIZE + b*LUT_SIZE * LUT_SIZE;

        assert(index > 35936);

        p_dst[x][0] = lut_data[index][0];
        p_dst[x][1] = lut_data[index][1];
        p_dst[x][2] = lut_data[index][2];
      }
    }
  }

  cv::Mat getResultImg() {
    return dst;
  }
};


int main() {
  my3D_lut_simple myLut;
  cv::Mat img = cv::imread("test.jpg");
  myLut.setSrcImg(img);
  myLut.read_lut_file("test.cube");

  std::cout << "convert start!\n";
  myLut.convert();
  std::cout << "convert finished!\n";

  cv::Mat dst = myLut.getResultImg();

  cv::imshow("test", dst);
  cv::waitKey(0);

  return 0;
}
実行結果(補間なし)
コンパイルして作成された実行ファイルと同じ場所にtest.jpgとtest.cubeを持ってきます。
そして実行すると、以下の様にLUTが適応された画像が表示されます。
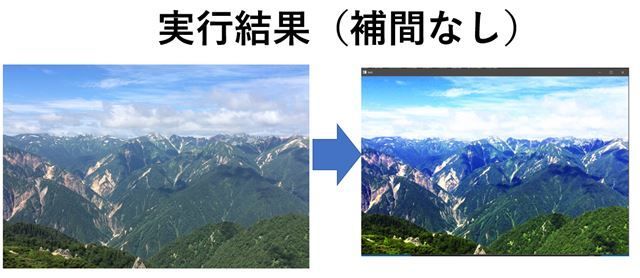
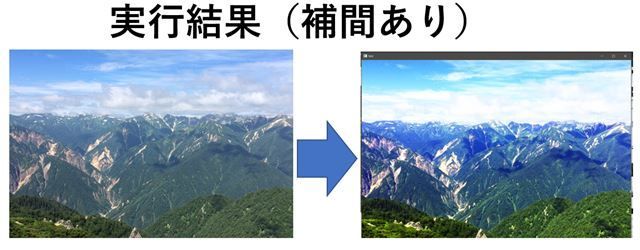
補完していないので、色がきれいなグラデーションにならず、階段状になっています。これを解決するために下の様なプログラムを書きました。
この画像は、2017年に北アルプスに行ったときの画像です。今年はコロナであきらめましたが、またいつか北アルプス行きたいです~~。燕岳最高!!
プログラム(補間あり)
計算にそれほど時間はかかりませんが、スピードを考えて作ったプログラムではありません。
「動けばいいか」という程度の考えで作ったので、最適化は一切考えていないです。
# include <opencv2/opencv.hpp>
# include <opencv2/highgui.hpp>
# include <opencv2/videoio.hpp>
# include <iostream>
#include <vector>
#include <string>
#include <fstream>

#define DISP(X) (std::cout << #X << " = "  << X << std::endl)

// https://qiita.com/iseki-masaya/items/70b4ee6e0877d12dafa8 を参考にしました
std::vector<std::string> split_naive(const std::string &s, const char delim) {
  std::vector<std::string> elems;
  std::string item;
  for (char ch : s) {
    if (ch == ' ') {
      if (!item.empty()) elems.push_back(item);
      item.clear();
    }else { item += ch;}
  }
  if (!item.empty()) elems.push_back(item);
  return elems;
}

#define LUT_SIZE 33

class my3D_lut {
private:
  int lut_size;
  cv::Mat src;
  cv::Mat dst;
  cv::Vec3f lut_data[LUT_SIZE * LUT_SIZE * LUT_SIZE];

public:
  // read .cube file
  int read_lut_file(std::string filename) {
    std::ifstream ifs(filename);
    std::string one_line;

    int i = 0;
    while (i < LUT_SIZE * LUT_SIZE * LUT_SIZE) {
      getline(ifs, one_line);
      std::vector<std::string> values = split_naive(one_line, (char)" ");

      if (values.size() != 3) { std::cout << one_line << " --> " << values.size() << std::endl; continue; }

      lut_data[i][0] = ::atof(values[0].c_str());
      lut_data[i][1] = ::atof(values[1].c_str());
      lut_data[i][2] = ::atof(values[2].c_str());
      i++;
    }
  }

  void setSrcImg(cv::Mat src_img) {
    src = src_img;
    dst = cv::Mat::zeros(src.size(), src.type());
  }

  cv::Vec3f _convert_pixel(cv::Vec3b color) {
    unsigned char pos[3]; // 0~33
    float delta[3]; //

    pos[0] = color[0] * LUT_SIZE / 256;
    pos[1] = color[1] * LUT_SIZE / 256;
    pos[2] = color[2] * LUT_SIZE / 256;

    delta[0] = float(color[0] * LUT_SIZE) / 256.0f - pos[0];
    delta[1] = float(color[1] * LUT_SIZE) / 256.0f - pos[1];
    delta[2] = float(color[2] * LUT_SIZE) / 256.0f - pos[2];


    cv::Vec3f vertex_color[8];
    cv::Vec3f surf_color[4];
    cv::Vec3f line_color[2];
    cv::Vec3f out_color;

    int index = pos[0] + pos[1] * LUT_SIZE + pos[2] * LUT_SIZE * LUT_SIZE;
    const int max_range = 33 * 33 * 33 - 1;

    unsigned int next_index[3] = { 1, LUT_SIZE, LUT_SIZE * LUT_SIZE };
    if (index % LUT_SIZE == LUT_SIZE - 1) { next_index[0] = 0; }
    if ((index/LUT_SIZE) % LUT_SIZE == LUT_SIZE - 1) { next_index[1] = 0; }
    if ((index/(LUT_SIZE * LUT_SIZE))% LUT_SIZE == LUT_SIZE - 1) {next_index[2] = 0;}

    // https://en.wikipedia.org/wiki/Trilinear_interpolation
    vertex_color[0] = lut_data[index];
    vertex_color[1] = lut_data[index + next_index[0]];
    vertex_color[2] = lut_data[index + next_index[0] + next_index[1]];
    vertex_color[3] = lut_data[index + next_index[1]];
    vertex_color[4] = lut_data[index + next_index[2]];
    vertex_color[5] = lut_data[index + next_index[0] + next_index[2]];
    vertex_color[6] = lut_data[index + next_index[0] + next_index[1] + next_index[2]];
    vertex_color[7] = lut_data[index + next_index[1] + next_index[2]];

    surf_color[0] = vertex_color[0] * (1.0f - delta[2]) + vertex_color[4] * delta[2];
    surf_color[1] = vertex_color[1] * (1.0f - delta[2]) + vertex_color[5] * delta[2];
    surf_color[2] = vertex_color[2] * (1.0f - delta[2]) + vertex_color[6] * delta[2];
    surf_color[3] = vertex_color[3] * (1.0f - delta[2]) + vertex_color[7] * delta[2];

    line_color[0] = surf_color[0] * (1.0f - delta[0]) + surf_color[1] * delta[0];
    line_color[1] = surf_color[2] * (1.0f - delta[0]) + surf_color[3] * delta[0];

    out_color = line_color[0] * (1.0f - delta[1]) + line_color[1] * delta[1];

    return out_color;
  }


  void convert() {
    if (src.empty()) { std::cout << "src image is empty!"; return; }
    int x, y, index;
    for (y = 0; y < src.rows; y++) {
      cv::Vec3b* p_src = src.ptr<cv::Vec3b>(y);
      cv::Vec3b* p_dst = dst.ptr<cv::Vec3b>(y);

      for (x = 0; x < src.cols; x++) {
        cv::Vec3f color_out = _convert_pixel(p_src[x]);
        p_dst[x] = cv::Vec3b(color_out[0] * 255.0, color_out[1] * 255.0, color_out[2] * 255.0 );
      }
    }
  }

  cv::Mat getResultImg() {return dst;}
};


int main() {
  my3D_lut myLut;
  cv::Mat img = cv::imread("test.jpg");
  myLut.setSrcImg(img);
  myLut.read_lut_file("test.cube");

  std::cout << "convert start!\n";
  myLut.convert();
  std::cout << "convert finished!\n";

  cv::Mat dst = myLut.getResultImg();

  cv::imshow("test", dst);
  cv::waitKey(0);

  return 0;
}
